US Recession Indicators Power BI Dashboard
Power BI Dashboard Tracking Recession Indicators: Macro-Economic Data and Google Trends using Web-Scraping and PyTrends API
Firstly, welcome to my blog! In this Power BI project, I’m diving into the world of economics and the stock market. I created this project because I wanted to understand what was happening during the market downturn of 2022. I was curious to know if the economy was actually at an inflection i.e. entering an early bull market. The link to the GitHub repository is here.
In the Github repository, you will find a Power BI dashboard which provides valuable insights into the US economy’s health. The dashboard is designed to give you a quick overview of the historical and recent economic trends, allowing you to track and analyze various key indicators that signal a potential recession.
What’s cool about this project is that it connects to free data sources via Web Scraping, and as such the dashboard can be refreshed to get the latest data. The pictures you see here are snapshots of what the economy looked like during the 2022 bear market.
Introduction
Recessions are significant economic events that can impact various aspects of a country’s economy. This Power BI dashboard aims to help users better understand and anticipate potential recessions by presenting a collection of key indicators that historically correlate with economic downturns.
Methodology
The dashboard is structured with three distinct pages, each focusing on different time frames and aspects of recession indicators.
Dashboard Pages
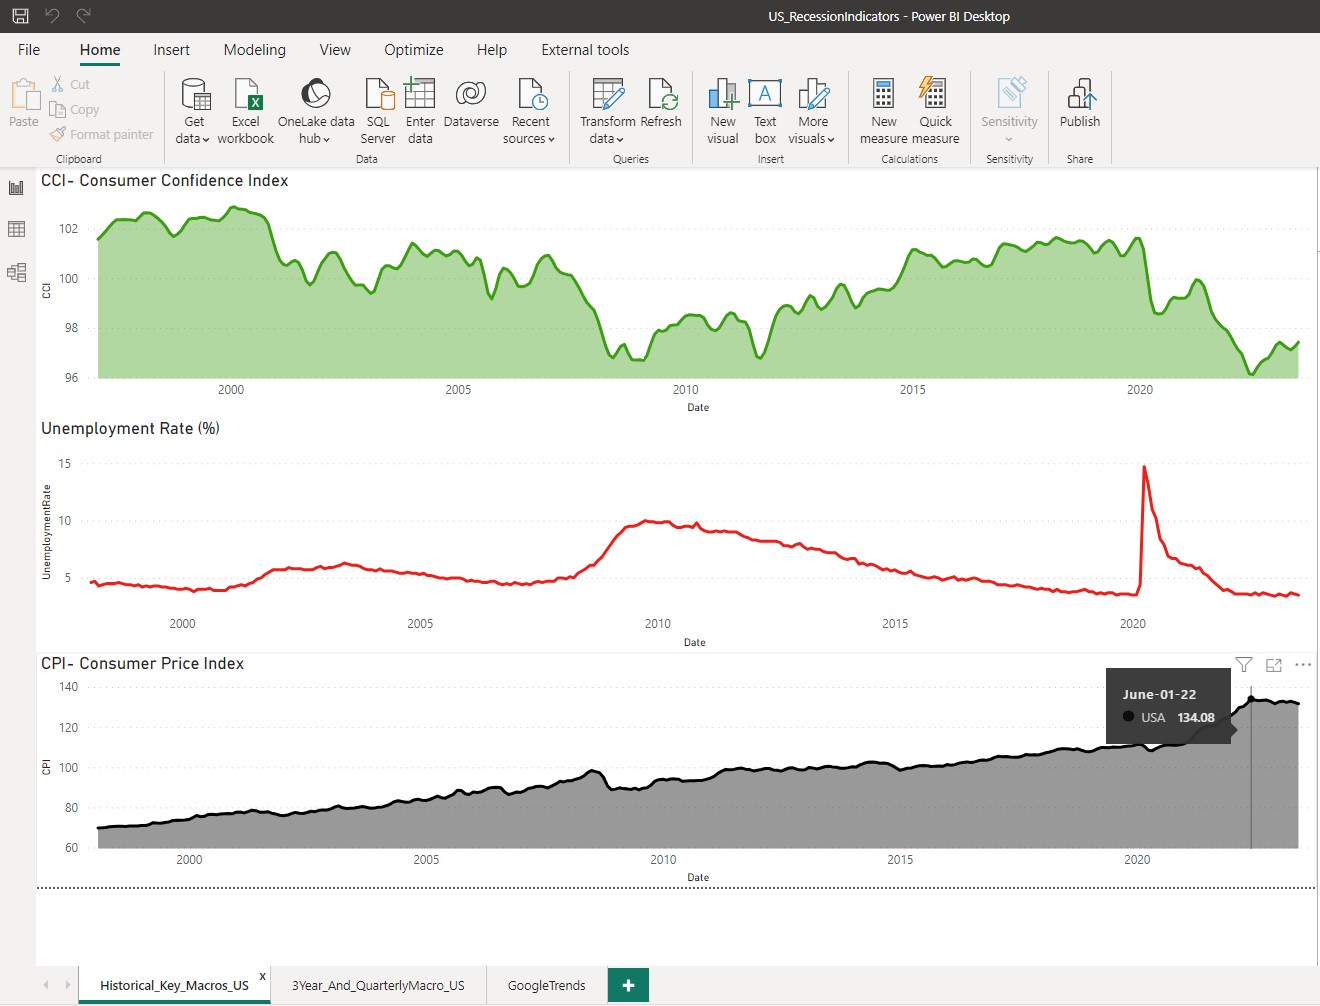
1. Historical All-Time Indicators:
- Consumer Confidence Index (CCI)
- Unemployment Rate
- Consumer Price Index (CPI)
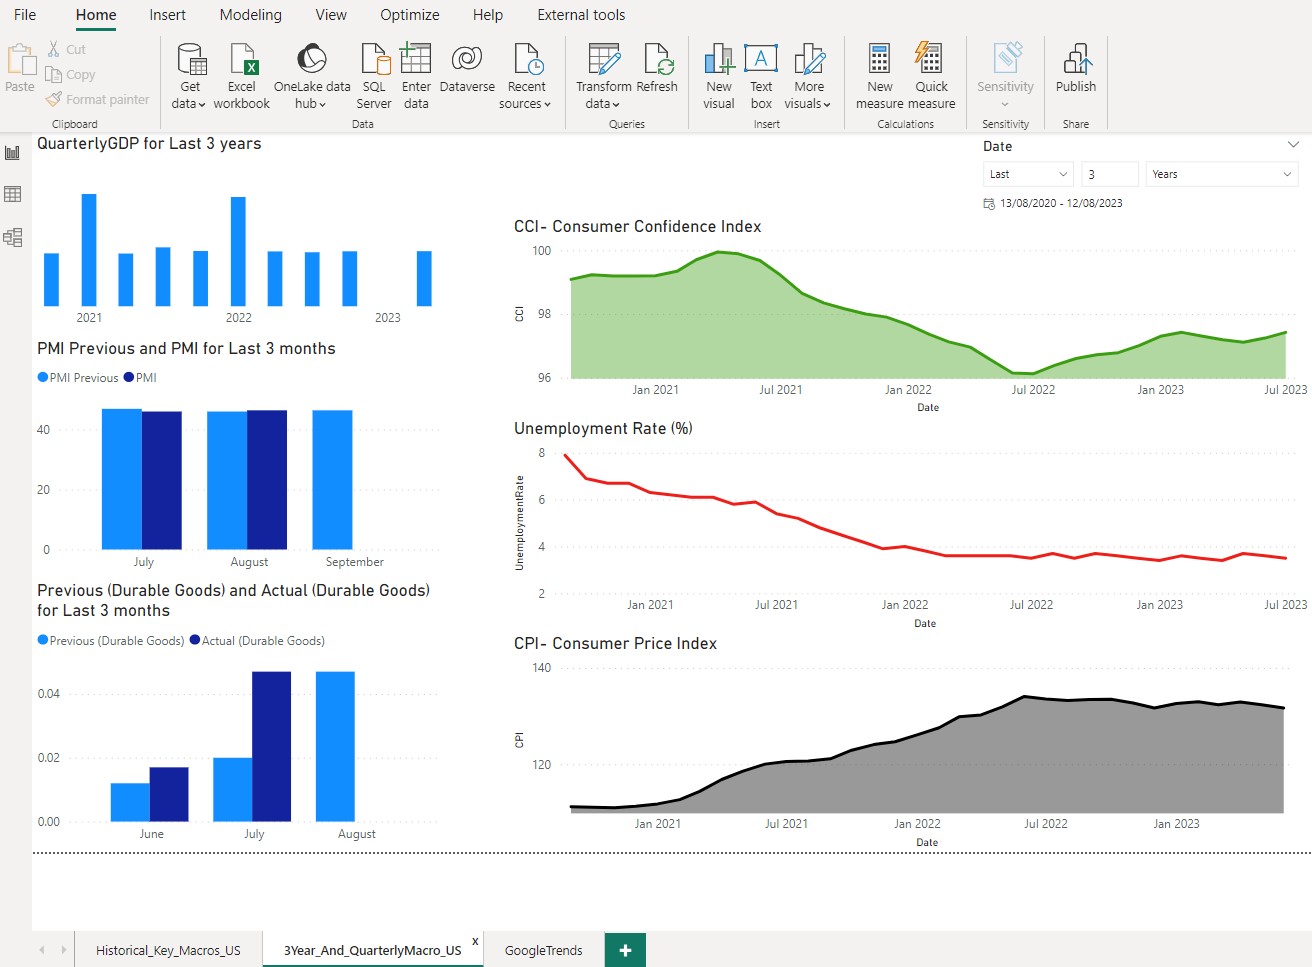
2. Recent 3-Year Indicators:
- CCI, Unemployment Rate, and CPI (Continued)
- PMI or Purchasing Managers’ Index (Comparison of Previous and Current Months)
- Durable Goods Orders (Comparison of Previous and Current Months)
- US GDP (Gross Domestic Product)
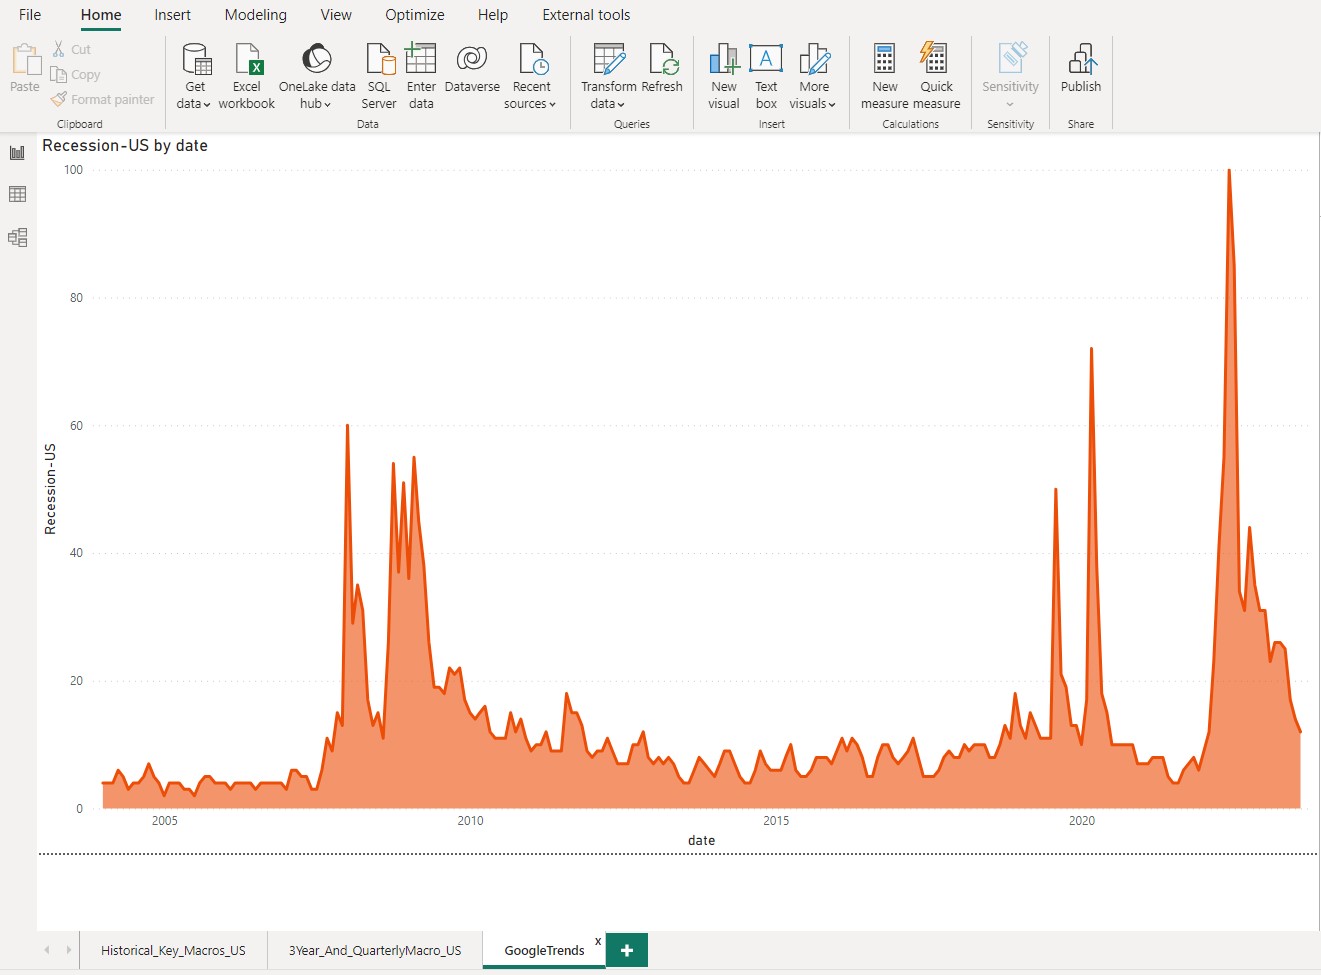
3. Google Trends Search Data:
- Google Trends search data for the term “recession” in the US
Relevance of Indicators
Each indicator holds significance in tracking and analyzing potential recessions:
- CCI, Unemployment Rate, and CPI: These indicators reflect consumer sentiment, labor market conditions, and inflation, providing insights into overall economic health.
- PMI and Durable Goods Orders: These indicators give insights into manufacturing activity and consumer spending patterns.
- US GDP: Gross Domestic Product represents the overall economic output and growth of the country.
- Google Trends Search Data: Analyzing public interest in the term “recession” can provide additional insights into economic sentiment.
Data Sources
The dashboard relies on two different data sources:
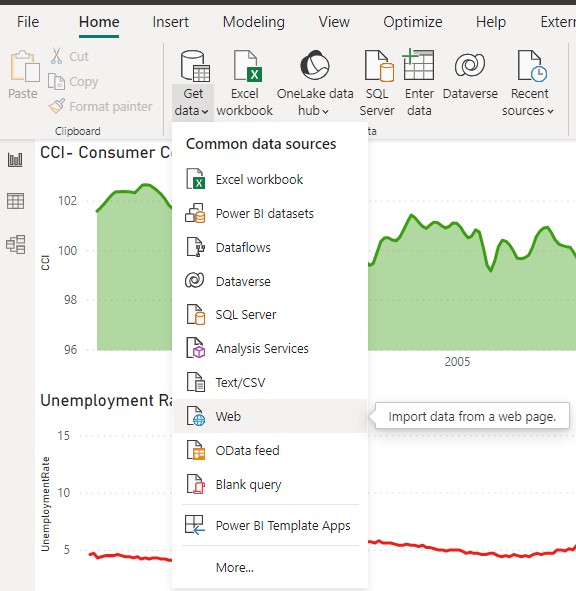
- Web (Internal PowerBI Web Scraping): Historical and recent economic indicators (CCI, Unemployment Rate, CPI, PMI, Durable Goods Orders, and US GDP) are obtained through web scraping from free OECD data sources. The links to data sources are listed below:
- For CCI, CPI, Quarterly GDP: https://stats.oecd.org/
- For PMI, Durable goods: https://tradingeconomics.com/united-states/
- Python Script with PyTrends API: A custom Python script queries the Google Trends search data for the term “recession” using the PyTrends API and directly provides the data to Power BI.
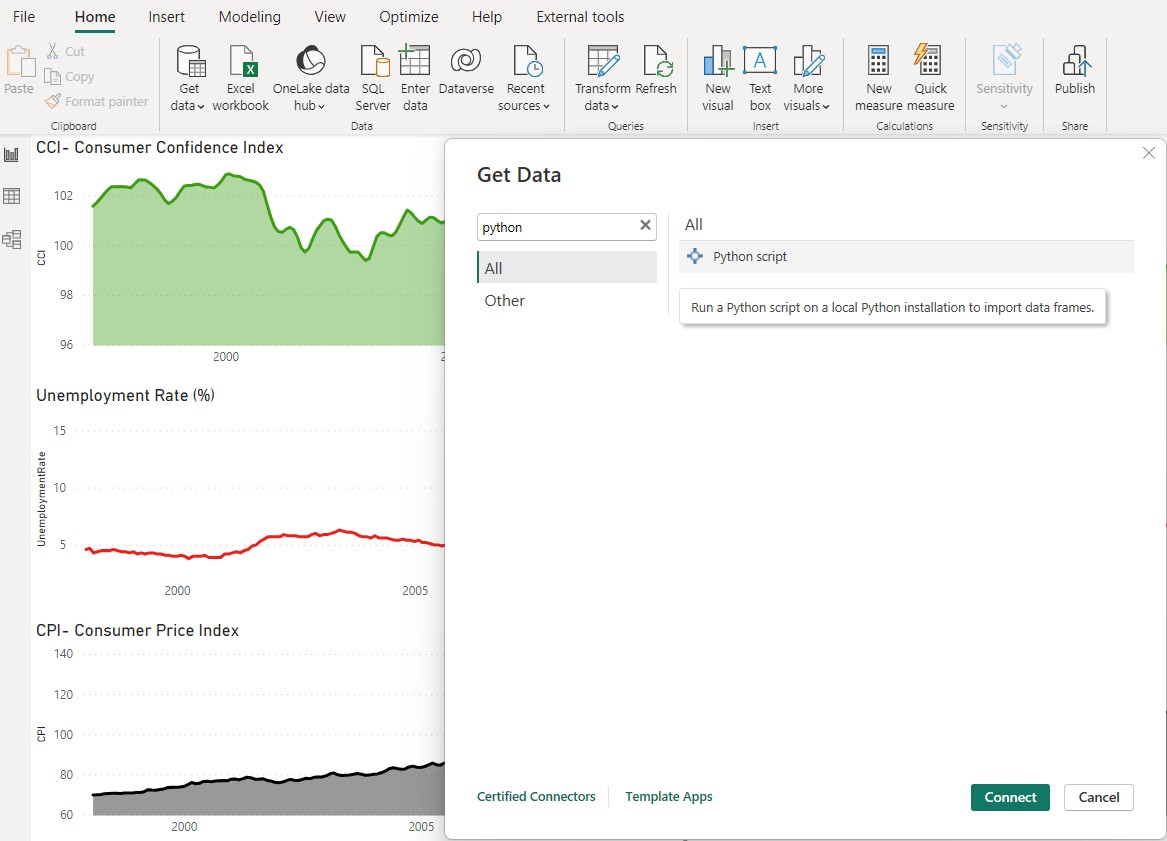
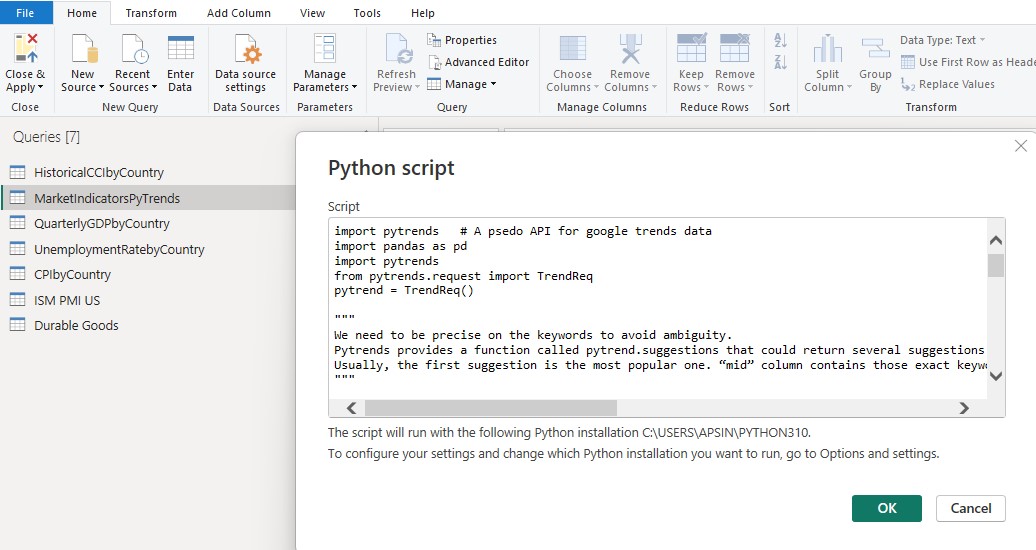
Python Script for Google Trends Data
The repository includes a Python script named ‘pythonScriptForPowerBIQueryUsingPyTrendsAPI’. This script is used to fetch Google Trends search data for the term “recession” using the PyTrends API. The script’s output is utilized as a data source in Power BI.
Usage
To use the Power BI dashboard, follow these steps:
- Clone this repository to your local machine.
- Open the Power BI file included in the repository.
- Ensure you have the necessary Python dependencies installed to run the script.
- Refresh the dashboard to reflect the latest data and customize the dashboard as needed and explore the insights provided by each indicator.
Contributions
Contributions to enhance and expand this dashboard are welcome! Feel free to fork the repository, make improvements, and submit pull requests.
By leveraging this Power BI dashboard, you can gain valuable insights into the US economy’s health and be better equipped to understand and anticipate potential recessions. Happy analyzing!